
Evening all.
Time for another look at $BTC and this time I’ve moved up to the weekly chart.
A few days ago the daily 50ma gave way and there was a rapid test of the 200 day ma. Both failed unfortunately and I feel that the bullish picture is now on its last legs with the weekly chart providing one last line in the sand before the $7,850 are beckons.
At around $8,450 price tested a triple support of the weekly 20, weekly 50 and a 50% retracement of this whole bullish rally we’ve seen since price took off in mid-December.
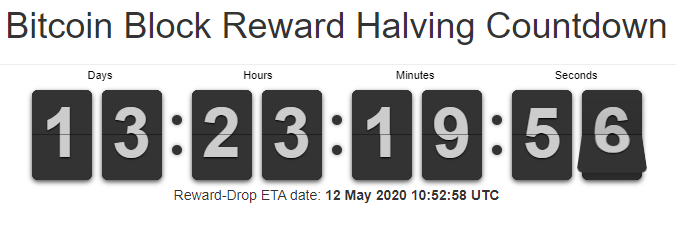
That’s a pretty good combination on a high timescale chart from a technical perspective and I’ve seen that a lot of Bitcoin traders were banking on a continued rally because of the Bitcoin Halving that is coming up around the 12th May.
I read an article the other day suggesting that over $300 million of positions were liquidated on BitMEX when price plummeted a few days and it might be that too many longs with too much leverage provided a target for those with deep pockets to take out.
I do some trading on Bybit but here on eToro I keep the leverage to 1X to ensure we have no issues with how wild price wants to move and I like that security. We have orders doing down into the 7k’s and I’m perfectly happy to buy it at a cheaper level at the moment.
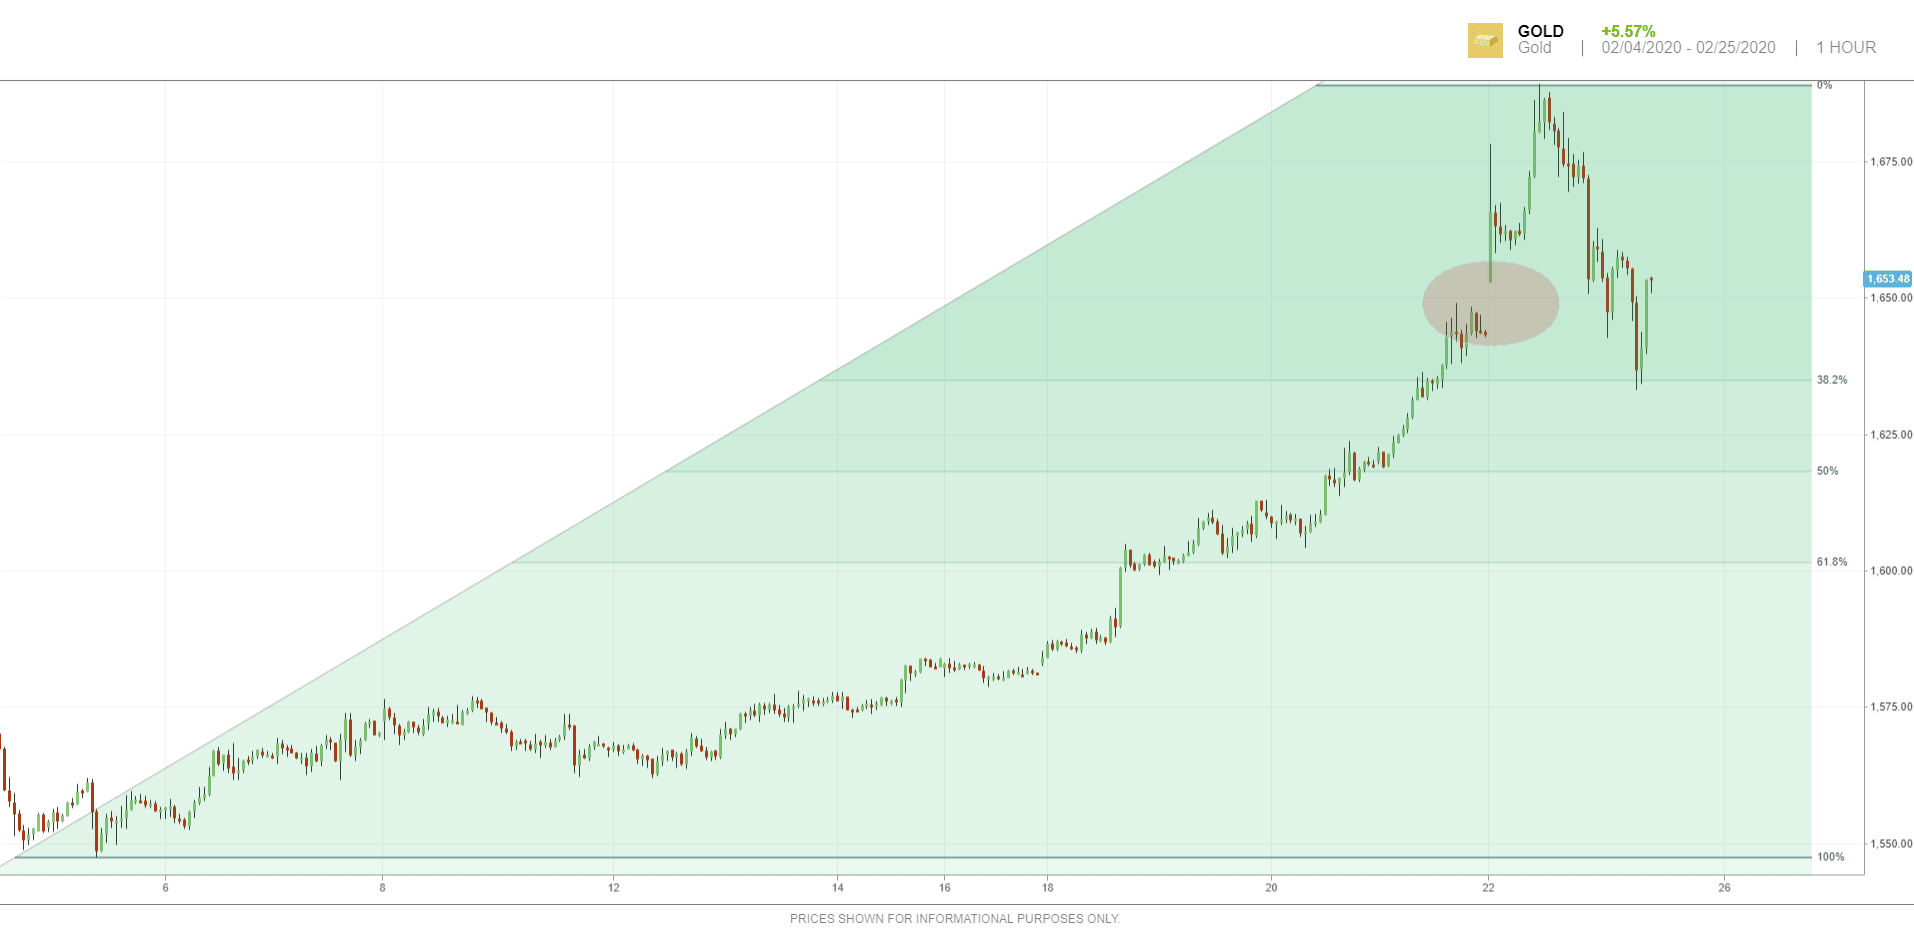
There was some criticism that Bitcoin did not act like Digital Gold like it’s supposed to this week, but we should remember that even ‘real’ $Gold didn’t perform much like a safe haven this week. One of the worst weeks for the stock markets ever and Gold managed to fall nearly 4%, and had a literal meltdown by its own standards on Friday!
I’d better stop rambling as the scheduled maintenance is due to start shortly here on eToro.
Thanks for your time.


